What is a Frequency Response Chart?
Frequency response charts can be confusing for those not familiar with them.
First, we should examine the heading.
Frequency Response on IEC Baffle (DIN 45575) @ 1W, 1m - Free Air Impedance
This tells us several things:
- "Frequency Response" - this indicates that the values we are measuring on the Y-axes are in comparison (or response) to changes in frequency, which is shown on the X-axis.
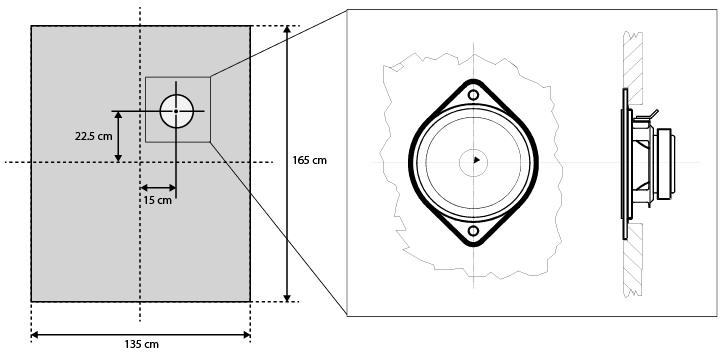
- "on IEC Baffle (DIN 45575)" - this tells us that the measurements are being conducted on a speaker which is mounted according to the IEC Baffle standards described in DIN 45575. This is a standard by which speakers can be easily measured to ensure consistency and accuracy. The word "baffle" refers to the prevention of the spread of sound in particular directions (in this case, in directions that would negatively affect measurements). This mounting is used to measure the dB SPL curve (described below). For the exact definition of this baffle, see the image in the dB SPL section below.
- "@ 1W, 1m" - this indicates that the measurements are taken at 1 Watt at a distance of 1 meter away from the speaker for the dB SPL measurements.
- "Free Air Impedance" - this indicates that the impedance curve (described below) is measured with the speaker unmounted (thus in "free air"), which is the standard way by which speaker impedance is measured.
There are essentially two components to the actual graph of the Frequency Response Chart.
The first of these components is the "dB SPL" curve, or Sound Pressure Level:
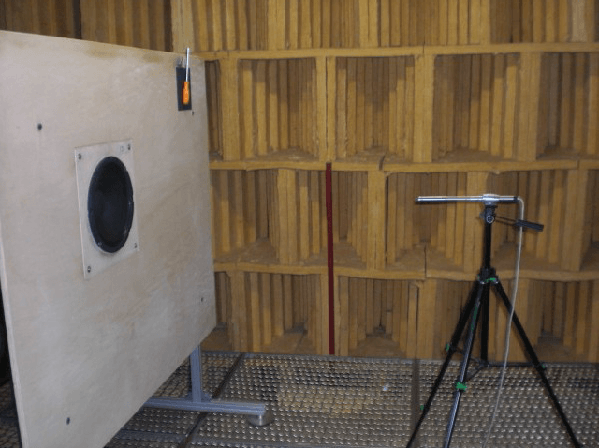
The y-axis on the left is the label for the "dB SPL" curve. This graph is a measurement of the sound pressure level measured by putting a microphone 1 meter away from the speaker and running a sine wave frequency sweep from 20Hz to 20kHz across the speaker (these are the values on the x-axis - the axis is a logarithmic scale). 1 meter is the standard distance for measuring these curves. This is what the graph heading "@1W, 1m" refers to. The measurements are conducted in an anechoic chamber to ensure that the results are accurate. See the picture below.
Sound pressure level (SPL) is a logarithmic measurement of the effective sound pressure of the speaker. It is measured in decibels (dB) above a standard reference level, which is usually the value considered the threshold of human hearing. Therefore, the lower limit of audibility is defined as a dB SPL of +0. There is no defined upper limit, but +191 dB SPL is the largest value possible in the Earth's atmosphere, and so it can be considered the upper limit for all practical purposes.
Below is an image of the IEC Baffle specification used for these measurements (described above).

Below is a picture taken of the actual IEC baffle setup used to measure the dB SPL curve at the SICA factory.

The second component of the Frequency Response Chart is the "Ohm" or "Impedance" curve:
The y-axis on the right is the label for the Impedance values (also called the Impedance Curve). The axis is a logarithmic scale. It is a measurement of the speaker's impedance with respect to the same sine wave frequency sweep run from 20Hz to 20kHz (these are the values on the x-axis). The speaker's ohm rating is an indication of the speaker's AC impedance, the variance of which can be seen on this graph. Looking at the wide range on the graph above, it is obviously impossible to assign a single impedance value to a speaker. However, the nominal impedance can serve as a single convenient value to represent and evaluate the speaker. This is why our specifications list a nominal impedance for a speaker.